Impact of Cycle Time and Service Level on your Inventory Levels
Clean, fast data enables proactive inventory control and management. Applied properly, advanced analytics can be leveraged to optimize your field inventory operations.
Previous articles discussed calculating optimized inventory levels for medical device field offices based on actual demand for cases—not just consumption. This article builds on that concept, discussing levers that management can pull in the short term to demonstrate impact on optimized inventory levels. Specifically, adjusting service-level expectations in the demand model and improving field territory cycle times. While there are other ways to impact the optimized inventory level, these two levers achieve the most immediate results.
Service Levels
The Service Level is the % of demand the operation expects to satisfy from a modeled location. In our demand-based asset optimization model, default service level of field offices is set to 95%, implying that 95% of the demand requests will be satisfied from the modeled location. We advise our clients to use multiple service levels based on the operational node of the network. For example, field offices and central loaner sites might be modeled at 95% and 99.9%, respectively. This approach creates a network where field offices cover the core business, and central loaners sites then become the last line of defense for long-tail products with infrequent demand and unusual volatility. With modeling strategies specific to each operational node, our clients drive asset optimization while achieving 100% delivery success—critical in the zero-failure Med Device industry.
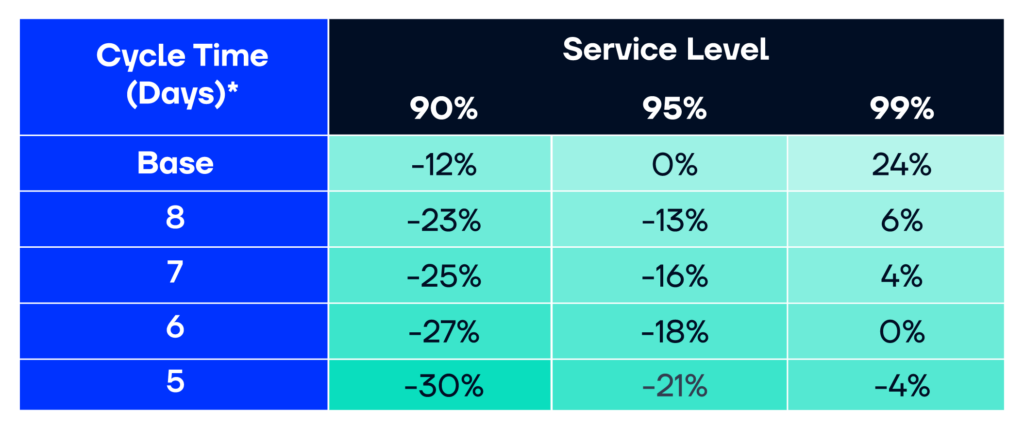
In the example below, Movemedical iterated the asset-based demand optimization model using various service levels and cycle time adjustments. These iterations demonstrate the impact of each change. The percentages in the figure represent the percentage change in the optimized inventory level from our base scenario that used a 95% service level and base (non-adjusted) cycle time. If we adjusted the service level to 99%, the site would need to add 24% more inventory to meet higher expectations. This change to service level results in $1m of additional stock required to support cases for a local office that currently carries $4m in inventory. If this same office decreases its service level to 90% we could reduce the stock by -12%, driving significant inventory savings. These inventory savings are partially offset by an increase in freight expenditure when sourcing from an alternate site as needed.

% Inventory change from Base cycle time & 95% service level.
Demand-Based Asset Model Recommended Quantity
It has proven beneficial to review all lower-demand items and exclude them from the core business nodes (Field Offices). When the average daily demand decreases, volatility drives up the costs to support the demand. See figure 2 to understand the relationship between average demand and volatility. Organizations incur high E&O costs when items are inefficiently distributed. The most conservative demand models require 1 unit wherever demand occurs. Clients achieve more aggressive savings by moving low-demand SKUs to centralized locations.
The reverse is true for high-demand SKUs. High-demand SKUs are most efficiently deployed closer to the surgical event, with the highest demand items consigned at hospitals and in trunk stock. This concept is true for even low-consumption, high-demand items such as backups for core products. Parking these items, while possibly not helping your E&O, significantly reduces your operational and freight expenses.

Cycle Time
Cycle Time refers to the time it takes from when inventory is picked off the shelf for it to be returned back to the office. We often break down cycle time into two parts: inbound and outbound (reverse) cycle time. Inbound indicates the time it takes to get to the hospital. Outbound refers to the time it takes to return the product back to the home location. Breaking down cycle time into inbound and outbound enables clients to prioritize operational improvements. Hospitals regularly drive the inbound requirements; our clients often cannot impact these lead times. Typically, our clients manage the outbound performance more effectively, because it is driven by their own reverse logistics and product returns. For a field office, we reasonably expect an efficient operation to achieve a total average cycle time of 5 days. This cycle time is achieved by delivering the product 2-3 days before surgery and returning the product 1-2 days after surgery.
Looking at figure 1, we adjusted the SKU’s cycle time when it exceeded our target scenario. For example, in our eight-day cycle time scenario, we reduced the cycle time of all kits and trays to 8 days when they exceeded eight days and kept all items with a cycle time of fewer than eight days the same. For the 95% service level, we found 2-3% reductions in required inventory with each incremental day cycle time improved. The local office achieved a 21% reduction in stock when it achieved a five-day or less cycle time. This savings represents $840k for a single site holding $4m in assets. Alternatively, the site achieves 99% service levels while keeping asset-value equivalent and reducing their cycle time to six days!
Improving cycle times for an office may be challenging as it requires behavioral modifications to achieve these targets. Simple improvements like including return ground shipping labels in outbound shipments can help an item return to the field office as early as the following day.
The Movemedical platform enables data collection to track in detail all movements of inventory.
With the right data applied correctly, you enable the measurement of important case life-cycle metrics such as cycle time, clean requests, and OTIF metrics, which in turn become powerful levers that can transform your business.
Optimize Your Inventory – Connect With Us
If an in-depth forecasting and field inventory management discussion makes sense – contact us here: info@movemedical.com / call 877.469.3992 or watch this VIDEO (executive case study)
Related Articles:
Learn More About Advanced Analytics for Inventory Management and Operational Excellence:


