Demand-Based Asset Optimization
How Much Inventory Do You Really Need?
Answering this question is often the top priority for our medical device partners, who are looking to reduce inventory in the field. Through the combined strength of collected actionable data and statistics, the Movemedical platform enables advanced analytics to provide a robust solution to this difficult problem.
In the following case study, we will review the implementation of our solution to optimize inventory levels at an implant medical device field office. This optimization includes many factors, including the inventory demanded from the field sales representatives, inventory cycle times, and the volatility of each of those measures. Most importantly, this demand model requires no behavioral modifications – unlike traditional consumption-based models.
The Data Collected
In the Movemedical platform, every interaction with inventory is tracked. This allows for actionable insights into stock movements.
For this model, demand was defined as the physical kits/trays put on loan for cases supported by the field office–including items fulfilled by other field offices and/or loaners environments. Capturing requests fulfilled by other offices enabled the model to see if the given field office would benefit from any additional inventory.
Inventory cycle times were calculated for each item: this is the total time elapsed from the moment the item was picked off the shelf until it was confirmed returned to the warehouse. As an office becomes more efficient, cycle times will reduce, which in-turn allows more demand to be satisfied with the same amount of inventory. By including cycle time as a factor in the model, it can automatically adjust the recommended inventory levels, accounting for how efficient an office is running.
Volatility greatly influences the amount of inventory required, as highly volatile items will require additional inventory to withstand the greater swings in demand. As volume increases or field offices are consolidated into large distribution centers, the volatility of inventory declines and more demand can be satisfied. To track volatility, averages, standard deviations, and coefficients of variation were also tracked for both demand and field office efficiency measures.
The Model (+Assumptions)
Several assumptions were made before building the model:
- A service level of 95% was set. This service level means that the model will statistically satisfy 95% of the demand. It is assumed that the additional 5% of unsatisfied demand could supplied by a central loaners environment or by shortening the cycle time of inventory. (100% Coverage, 95% on-hand inventory)
- Strict system and process adoption are assumed. This drives data integrity in the environments being analyzed, ensuring all inventory transactions were accurately recorded on the Movemedical platform.

The Results
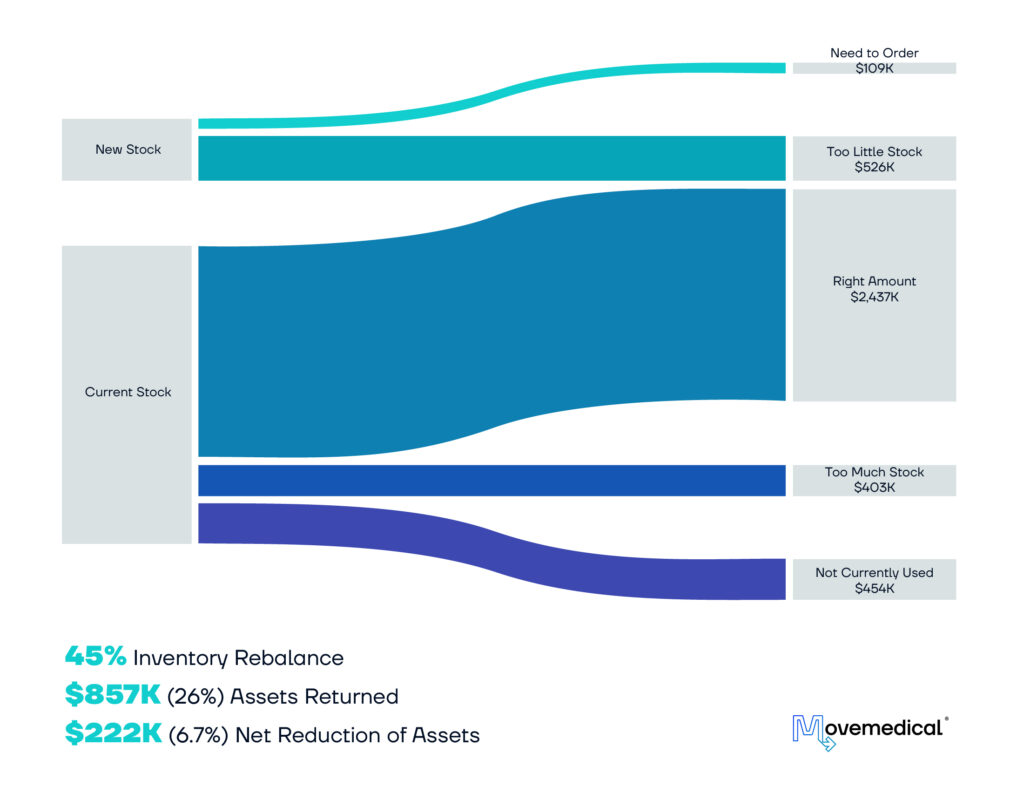
The Sankey chart above illustrates the differences between the current stock and the newly optimized inventory levels. It should be noted that the total inventory value is calculated at cost.
The model demonstrates several increases and decreases to inventory based on recent historical demand. For the decreases, $454k is coming from items which had no demand during the period analyzed for the model, and an additional $403k is coming from items which were held in a higher quantity than what the model output suggested. For the increases, $109k is coming from items which were seeing demand but had no inventory available at the field office, and an additional $526k is coming from items which were held in a lower quantity than was the model output suggested. Overall, this results in a $222k net reduction of assets for the period, with $856k of assets returned to the loaners environment for deployments to other regions. During this case study there was a high restock volatility which drove an increase in demand with flat case growth. Using a more normalized demand profile we saw inventory reduction levels upwards for $800k.
The Future (additional improvements)
The demand model is essentially the first step in a phased approach towards optimizing demanded resources and providing what is needed to support surgery.
Following the demand model implementation, we can then optimize consigned inventory, setting DOH targets by leveraging consumption patterns coupled with statistical safety stock. Once these models have been implemented, we can start to focus on the reverse logistics aspect. This will require some behavioral modifications in the field, and will help us further reduce cycle times and DOH. In the longer term, looking at operational consolidation and site consolidation will reveal opportunities for greater operational efficiencies. Consolidating sites will increase inventory cycle times and freight expenses, but we should see much more significant savings in facility and labor expenses (not to mention consolidation will also lead to reduced demand volatility).
Having the right data is the first step. Using that data with the right models allows you to optimize your field inventory without any behavior change.
Once this is done, imagine what could be accomplished next? For more on Demand, visit www.movemedical.com/demand today.
If you want to find out and start off your team down this path, give us a call.
Optimize Your Inventory – Connect With Us
If an in-depth field inventory management discussion makes sense –
contact us here: info@movemedical.com / call 877.469.3992
or watch this VIDEO (executive case study)
More articles to read:


