Applying Different Analysis Methods to Hierarchical Case Volume Data Requires Collecting Lots of the RIGHT Data (and knowing how to apply it).
The Need to Look into the Future
Getting ahead of the curve is crucial to the success of operations planning in any space, and healthcare is no exception. Without a leading indicator of what is coming in terms of demand, inefficiencies arise throughout the supply and operations chains, which can potentially cause missed cases. Leveraging available data to forecast future demand allows for more accurate supply planning as well as effective inventory planning and management.
Movemedical collects actionable data for enterprise manufacturers and distributors of medical devices through its comprehensive software platform. This data is used to provide insights and analytical solutions to the complex problems plaguing the healthcare space. As a demonstration of embedded forecasting possible within the Movemedical platform, historical case volume data across various clients was pulled to train multiple models against. The goal of this exercise was to highlight the forecasting capability of the Movemedical platform to an executive audience. For a high-level example, it was decided to forecast overall case volumes as well as case volumes by business segment.
While forecasting future case volumes is nothing novel or unique to the Movemedical application, the operational data collected alongside the historical case volumes data becomes invaluable when paired with a forward-looking solution such as this.
(The Right) Data Collection and Preprocessing
All steps of the case lifecycle are tracked through the Movemedical platform. From the time a case is first boarded in the system until usage is added and it is closed out after a successful procedure, all touchpoints and interaction data are tracked. To model historical case volumes, all completed cases from January 2021 until the end of February 2022 for specific clients were analyzed – this dataset included the surgery date for a given case and the type of procedure.
When creating forecasting models, it is most effective to include as much historical data as possible to fully capture any seasonality present in the data. The longer a client has been utilizing the Movemedical platform, the more accurate data is available. With more data, clients have more options for robust forecasting models.
Two Methods: Top-Down Versus Bottom-Up
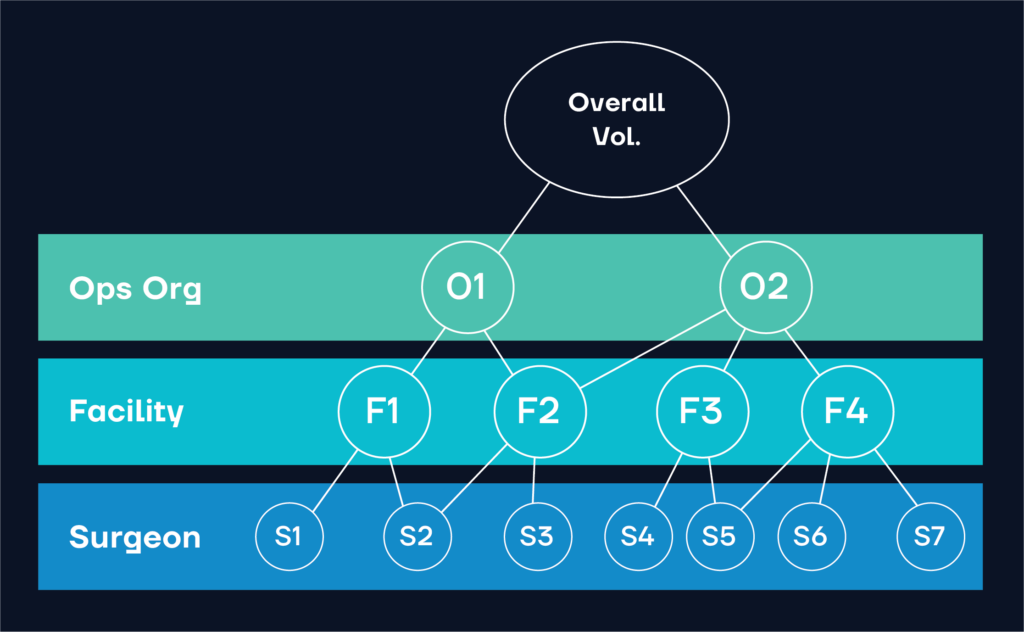
Case volume data can be visualized in a hierarchical format based on the various factors included when creating a forecast. As an example, overall case volume for a given timeframe can be broken down by supporting operations org, facility, and then surgeon (as in the example graphic below). The two primary hierarchical forecasting methods are called top-down and bottom-up.
In the top-down method, an overall forecast is first created from aggregate historical data. This forecast is then disaggregated down to each level of the hierarchy based on the historical proportions. In the example hierarchy diagram below, in the last 3 months if O1 has 30% of the case volume and O2 had 70% of the case volume, then the overall forecast would be split 30/70 between the two org units.
In the bottom–up method, a forecast is first created at the lowest level of the hierarchy. In the diagram below, a forecast for each individual surgeon would be generated. These forecasts are then summed up the hierarchy using a similar proportional approach to top-down.
There are pros and cons to both top-down and bottom-up methods (outlined in the table below). These constraints must be considered before building a forecasting framework. The complexity of the model will be determined by the availability of computing power, the amount of historical data, and the desired level of detail in the final model.
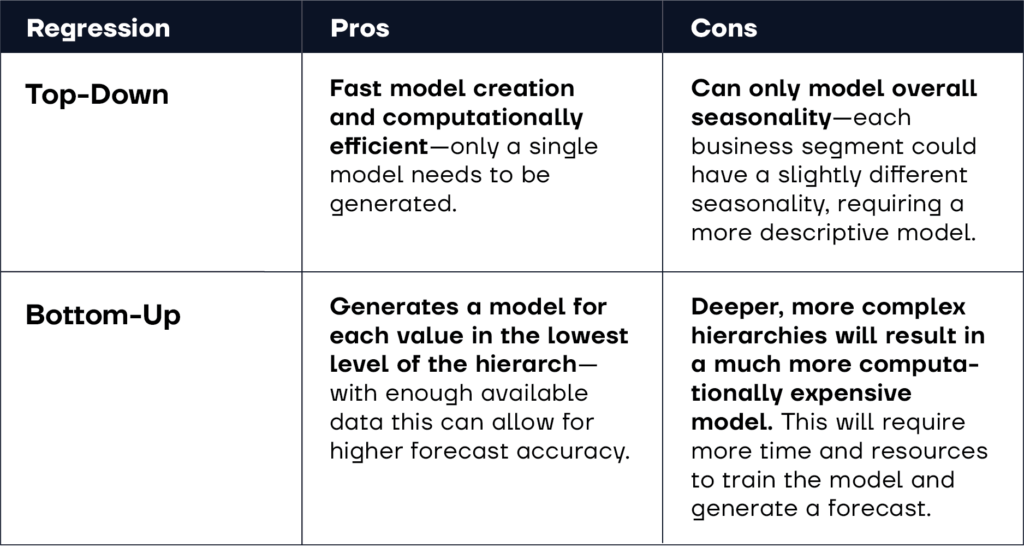
Top-Down Fast model creation and computationally efficient – only a single model needs to be generated. Can only model overall seasonality – each business segment could have a slightly different seasonality, requiring a more descriptive model.
Bottom-Up Generates a model for each value in the lowest level of the hierarchy – with enough available data this can allow for higher forecast accuracy. Deeper, more complex hierarchies will result in a much more computationally expensive model. This will require more time and resources to train the model and generate a forecast.
While it can be tempting to always create the most detailed model possible, there are limitations to modeling a hierarchy that is too complex. The further down a detailed hierarchy is traversed before fitting a model, there will inherently be less data available to train the model against. This is due to the need to create detailed subsets of data for each given level.
High Performance Outcomes
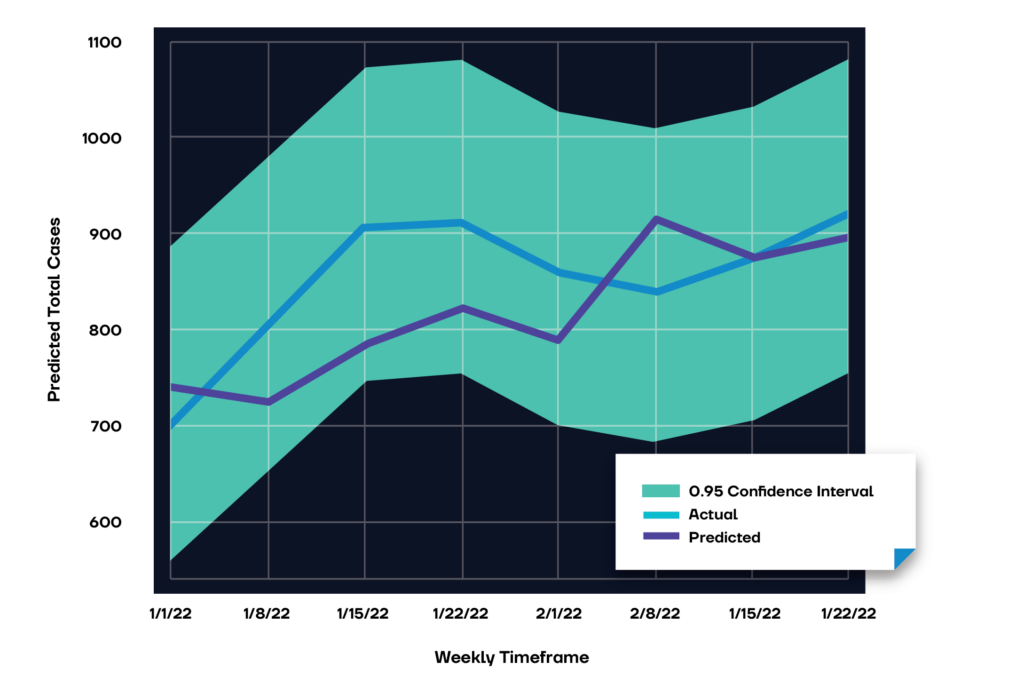
Using an additive regression model, forecasting overall case volume from January 2022 through the end of February 2022 resulted in a forecast accuracy of 92.4% over those 8 weeks. The image below shows the predicted weekly case volume vs actual case volume as well as the 95% confidence interval for the forecast.
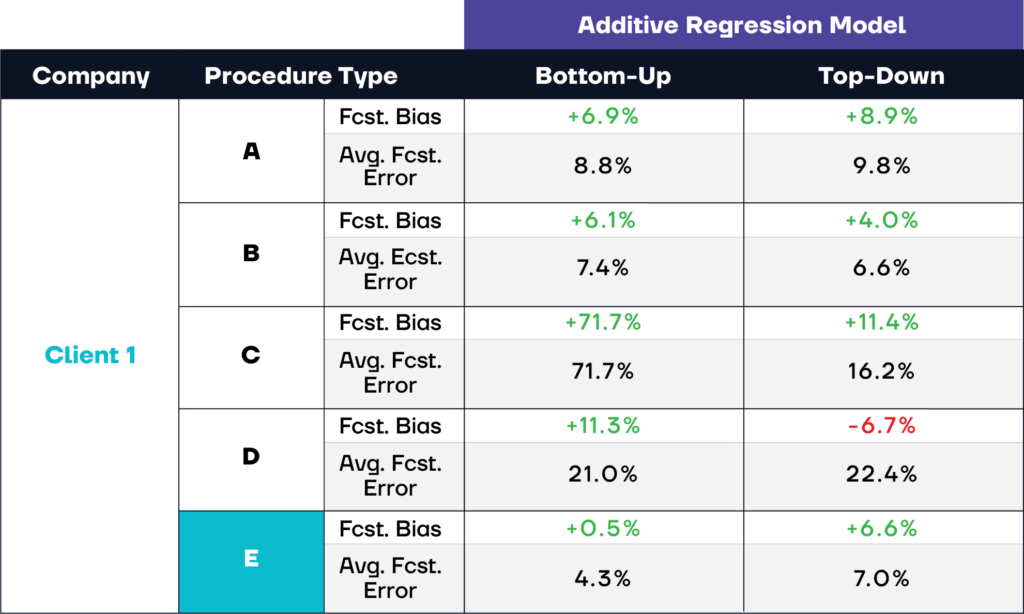
Going one step further, a case volume forecast was created for each business segment of a given client. As expected, the top-down approach tends to perform slightly better than bottom-up in most cases due to limited data when forecasting at a lower level in the hierarchy. The only exception is business segment E below – this segment has slightly more available data and does not follow the same seasonal trend as the other four segments. As a result, the top-down approach does not accurately model the seasonality of E. The bottom-up approach in this case results in a lower figure for both forecast bias and forecast error.
Accurate Forecasting Means Better Planning
Forecasting is a versatile tool that allows partners to leverage the full benefit of their data collected by the Movemedical Platform. Employing multiple and varied approaches ensures development of a robust forecast. Each of the models will perform better in certain situations, depending on the characteristics of the business, the desired level of detail in the forecast, the amount of data available and the present seasonality. It is essential to leverage and test multiple models to find the right combination or the best suited forecast for each particular business.
The power of forecasting combined with the actionable insights generated from Movemedical’s inventory optimization modeling will drive invaluable increased efficiency in field inventory operations.
To find out more and start off your team down this path, give us a call.
Optimize Your Inventory – Connect With Us
If an in-depth forecasting and field inventory management discussion makes sense – contact us here: info@movemedical.com / call 877.469.3992 or watch this VIDEO (executive case study)
More articles to read:
Learn More About Advanced Analytics for Inventory Management and Operational Excellence:
